How to use UptimeMonke
Last updated 4 October 2026
The short version. Add a monitor, tell us where to reach you, and we check your service around the clock from our probe network. When something breaks you get a message; when it recovers you get another. Everything below takes about five minutes end to end, and the free allowance is genuinely free — no card, no trial clock.
Create your first monitor
Sign in
Use Google, GitHub, Apple, or an email address and password. An email sign-up has to be confirmed before the API will accept anything — the confirmation link does that in one click.
Add a monitor
Press New monitor on the dashboard, give it a name you will recognise at 3am, and choose what kind of check it is. There are seven, and picking the right one matters more than any other setting:
| Type | What it needs | What counts as down |
|---|---|---|
| WebsiteHTTP | A URL | The request fails, times out, or returns a status you did not allow. |
| KeywordHTTP + text match | A URL and a word or phrase | The page loads but the text you expect is missing — or text you forbade appears. Catches the error page that returns 200. |
| PortTCP | A host and port | The port stops accepting connections. For databases, brokers and anything that is not HTTP. |
| DNS | A name, record type, and what you expect back | The record disappears, stops resolving, or resolves to something other than the answer you pinned. |
| SSL | A host | The certificate is invalid, or expiry comes within your warning window. Warns before it breaks, not after. |
| PingICMP | A host | The host stops replying to ping. |
| Cronheartbeat | Nothing — we give you a URL | Your job stops calling us. Inverted: for cron jobs and backups, where silence is the failure. |
If your site returns 200 on its own error page — and many frameworks do — an HTTP monitor will call that healthy. Use a Keyword monitor and match on something only the working page contains. This is the single most common reason an outage goes unnoticed.
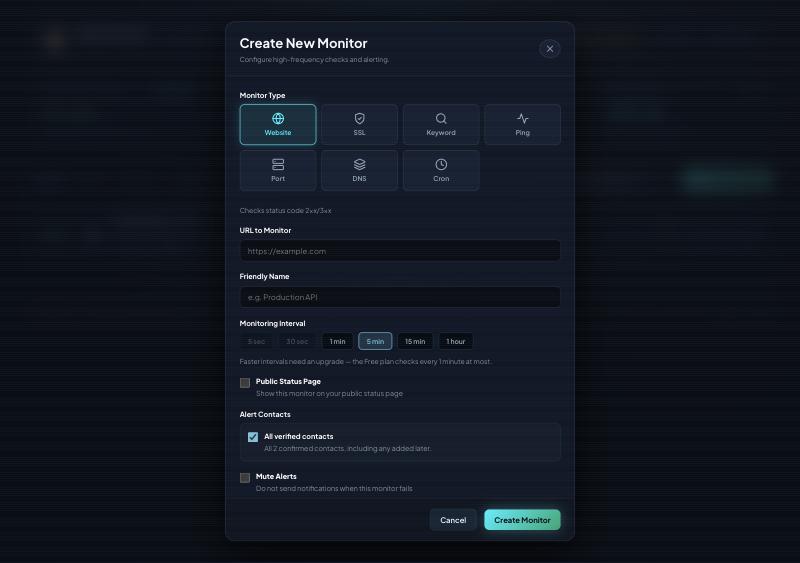
Save it
The monitor starts as Pending and turns green or red after its first couple of checks. That is not a stall — see below for why we wait.
Choose how often to check
The interval is how long we wait between checks. Shorter means you hear about an outage sooner, and it costs proportionally more of your daily allowance — a 30-second monitor is twice the work of a 60-second one, so it counts twice.
Your free allowance is 14,400 checks per day, which you can spend however you like:
| Interval | Checks per monitor per day | Monitors on the free allowance |
|---|---|---|
| Every 1 minute | 1,440 | 10 |
| Every 5 minutes | 288 | 50 (the monitor cap) |
| Every 15 minutes | 96 | 50 (the monitor cap) |
Free accounts check as often as every 60 seconds; supporters can go down to 5 seconds. If a change would not fit your allowance we refuse it with the actual number, so you can see what it would cost rather than guess.
A good default is 60 seconds for anything customer-facing and 5 minutes for everything else. Checking a marketing page every 30 seconds buys you nothing except a faster-shrinking allowance.
Set up alerts that arrive
A monitor that detects an outage silently is no better than no monitor, so this is the part worth getting right.
Add an alert contact
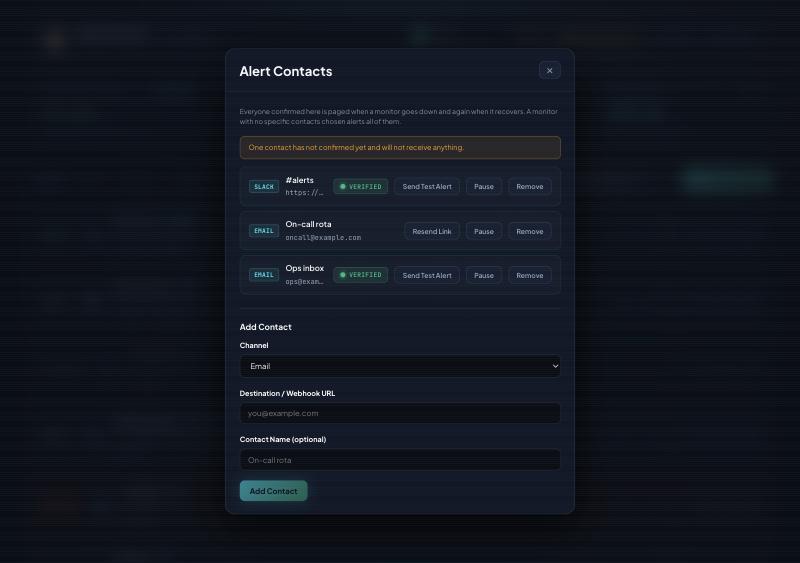
Press Alerts in the dashboard header. We deliver to email, Slack, Discord, Telegram and webhooks, plus push notifications on the mobile apps.
Confirm it
Every contact has to be confirmed before it will receive anything. We send a confirmation message — click the link in it. An unconfirmed contact is skipped, which is the most common reason alerts never show up.
Leave the monitor's contact list empty
This is deliberate and worth understanding: a monitor with no contacts chosen alerts everyone confirmed in your workspace. It does not alert nobody. Silence is never the default here.
Pick specific contacts only when you want to narrow who hears about a particular monitor. If you want a monitor to stay genuinely quiet, use Mute — it is explicit, and the dashboard badges it so nobody mistakes a muted monitor for a healthy one.
Alerts are not sent on a single failed check. By default a monitor has to fail twice in a row before it is called down. One dropped packet should not wake you, and this is what makes that true. You can raise the threshold per monitor if a service is noisy.
You can send a test message to any confirmed contact from its row. It takes the same path as a real alert, through the same code and the same credentials, and the result shows you the provider's actual response — so a passing test means delivery genuinely works, not that a shortcut succeeded.
Read your dashboard
Each monitor shows its current state, how long it has held it, its recent response time, and uptime across the window you pick. Four windows are available: 24 hours, 7 days, 30 days and 90 days. It opens on 24 hours on purpose — a live outage averaged over 90 days rounds away to nothing, and the page would read green while your service was down.
Response time is measured the way a first-time visitor experiences it. We deliberately do not reuse connections between checks, so every measurement includes DNS, the TCP handshake and the TLS negotiation. The number is a little higher than tools that keep a socket open, and it is the honest one — it is also how an expiring certificate stays visible instead of being skipped.
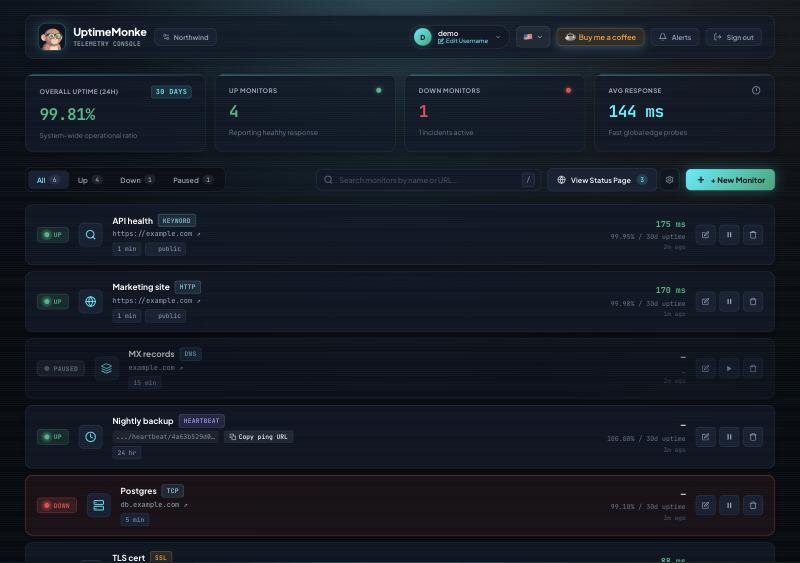
Times are shown in your own timezone, wherever you open it.
Publish a status page
A status page is a public URL showing the health of the monitors you choose — useful for customers, and for stopping the question before it is asked.
Monitors are private by default. Tick Show on status page on each one you want public. You can set the page title, description and custom URL in Settings.
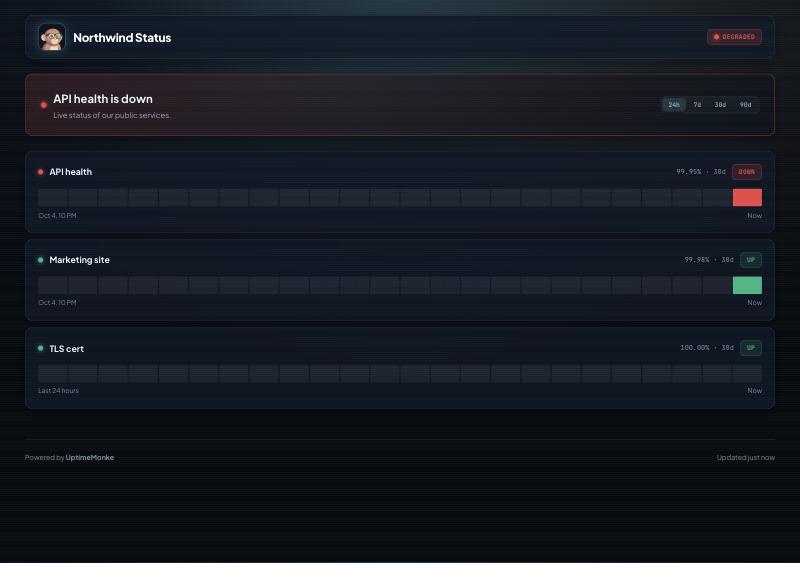
A published page shows each monitor's name and health, and nothing else. It never reveals the address being checked, the keyword being matched, your alert contacts, or the text of an error — your status page cannot leak your infrastructure.
Monitor a cron job
Everything above watches something that answers. A heartbeat monitor is the inverse: it watches for something that is supposed to call us, and alerts when the call does not come.
Create one and we give you a URL. Have your job request it on success — at the end of the script, after the backup has actually finished:
# at the end of your backup script
curl -fsS https://api.uptimemonke.com/heartbeat/YOUR-TOKEN
Tell us how often to expect it. If the job dies, hangs, or never starts, the call does not arrive and you hear about it. This catches the failure mode that uptime checks cannot see at all — a nightly job that quietly stopped running three weeks ago.
Limits and capacity
| Free | Supporter | |
|---|---|---|
| Checks per day | 14,400 | + 10,000 per $1 donated |
| Monitors | 50 | 200 |
| Fastest interval | 60 seconds | 5 seconds |
| Cost | Free forever, no card | One-off $2.99, no subscription |
There is no trial and nothing expires. The free allowance is permanent. Donations are one-off — there is no recurring charge to forget about and no card kept on file for one.
Running out of credit never stops your monitoring. Hitting zero opens a 7-day window at full service, after which the workspace falls back to the free allowance — not to nothing. Existing monitors keep checking. Only adding new ones and speeding up existing ones are blocked. Silently stopping someone's monitoring over a balance would be the worst version of the failure this product exists to prevent.
The mobile apps
UptimeMonke has apps for Android and iOS. They show the same live state as the dashboard, and they are the fastest way to receive an alert — push arrives whether or not you have email open. Add the device as an alert contact from within the app, and confirm it like any other.
When something looks wrong
My monitor says Pending
It has not completed enough checks yet. A monitor needs more than one result before it will claim a state, so a new one stays pending until its first checks land. If it is still pending well past its interval, open it and look at the last error.
I never got an alert
In order of likelihood: the contact was never confirmed; the monitor is muted; or the failure did not last long enough to clear the confirmation threshold. Send a test message to the contact — it reports the real delivery result, so it distinguishes "not configured" from "configured and rejected by the provider".
My response times look slower than other tools report
Expected, and deliberate. We do not reuse connections, so every number includes DNS, TCP and TLS. Tools that hold a socket open report a figure no real visitor ever experiences.
It will not let me monitor an internal address
Addresses on private, loopback and link-local ranges are refused, and the refusal follows redirects and hostname lookups rather than just checking the text you typed. Our probes run inside a cloud network; a monitor that could reach private addresses would be a way to make our servers probe things on your behalf. To watch something not reachable from the public internet, use a heartbeat monitor and have the machine check in.
Something else
Use the feedback button in the dashboard. It reaches us directly, and we read all of it.